Obesity spreading
What is driving the obesity epidemic in US?
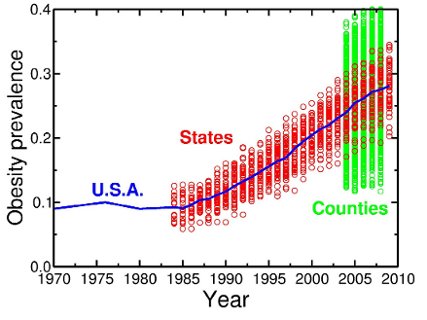
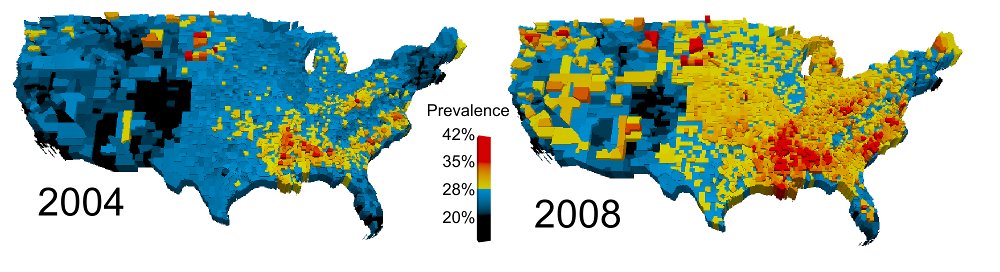
Time evolution of obesity prevalence in US
Obesity levels in USA have been increasing sharply since the end of 80's. What is driving this explosion?
We performed a spatial spreading analysis, in order to determine whether the epidemic can be attributed to collective behavior,
or if it can simply be explained on the basis of individual choices.
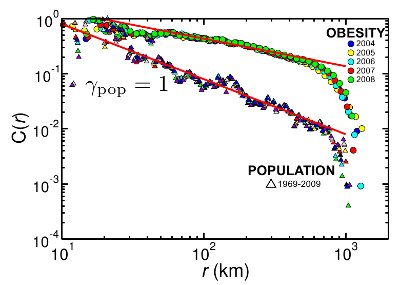
Therefore, we calculated the correlations in the percentage of obesity between any two US counties, as a function of the distance between these two counties.
In simple terms, correlation measures how 'similar' are the obesity levels between two counties that are at a distance r from each other.
Correlations in obesity and in population distribution
Of course, we know that the population is also not randomly distributed, so correlations exist on how people are spread on the map. As a reference, we also computed the correlations in population distribution. When comparing the two, the correlations in obesity are much stronger than in population, which means that obesity levels at a given distance are more 'synchronized' with each other than population. In fact, we find strong correlations up to roughly 1000 km!
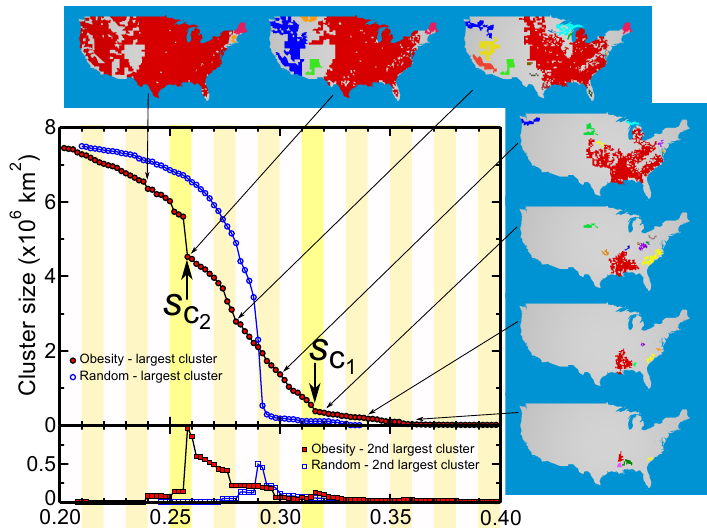
Variation of the obesity clusters as we lower the obesity prevalence threshold
Strong correlations imply, then, the existence of robust clusters. We can use ideas from percolation theory to study these clusters. We use a threshold value, roughly defined as the lowest possible value that we accept as significant obesity prevalence. As we lower this threshold, we can determine the hierarchical organization of these clusters. This process can highlight the clusters and their inter-connections. Further analysis (details in the paper) suggests that obesity spreading is similar to a critical point in a system undergoing a phase transition.
Our results indicate that obesity spreading is a collective phenomenon, where significant parts of the country are synchronized in simultaneous obesity increase.