Network similarity and network comparison
Download the code
The source code in C for the n-tangle method, which quantifies the similarity of two networks, can be found here. Please read the README.txt file first.
Complex network comparison
Can we compare two complex networks for similarity? The answer would be simple if there were just a small number of features which would fully characterize the structure. Even then, we would still need to decide on the requirements for similarity. For example, two structures may be similar in terms of percolation because the remaining structure has the same size as nodes are removed. In another example, it may be enough that there is no difference in diffusion properties.Many of the current studies have tried to consider a large number of properties in complex networks and create a vector based on that. One could consider the degree exponent, the clustering coefficient, the modularity coefficient, etc or even the entire distributions such as the degree distribution and the clustering distribution. However, there is no clear way to identify the relative weight of each vector component, and how these should be combined to create an index of similarity that can be widely used.
A cleaner approach has been the use of motif or graphlet similarity. In this case one considers all possible configurations of n nodes and attempts to determine whether the relative frequency of each pattern appears is similar in two structures. The main problem here is that the number of patterns increases exponentially fast with n and there is no clear quantitative way to sort these patterns.
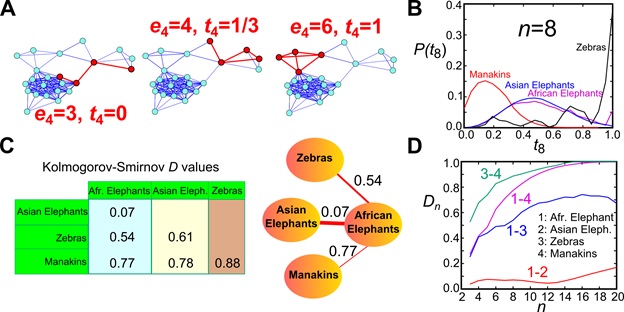
The n-tangle method. (A) We randomly sample connected induced subgraphs of n nodes and calculate their normalized link density. (B) We construct the n-tangle histogram for a given value of n (the example shows the 8-tangle distribution for 4 animal social networks). (C) We calculate the distance between any two distributions I and J through, e.g., a Kolmogorov-Smirnov statistic D. These D values are used as the distance between the original networks and can be mapped to a minimum spanning tree (shown here for the four networks), a hierarchical tree, or a threshold-based network. (D) Variation of the distance between these 4 networks as a function of the subgraph size n.
To overcome this problem, we recently proposed the n-tangle (Topological Analysis of Network subGraph Link/Edge) density method. In practice, we relax the requirement of the motif/graphlet exact matching pattern. We still consider all possible induced subgraphs with n nodes, but instead of matching the pattern we calculate the link density in the subgraph. Consider for example an induced subgraph of 100 nodes. All patterns that include e.g. 1000 links are classified by n-tangle as being the same. In general, and for most practical applications, it makes little difference how these 1000 links are distributed in the 100 nodes, for a large number of properties. However, now we have one numerical index to characterize the structure of n nodes (n-tangle density).
To directly compare the structure of two networks, we calculate the distribution of n-tangle density in each structure. This distribution represents the fingerprint of the structure at this scale. To determine the degree of similarity we need to calculate this distribution for each of the network and compare these fingerprints, e.g. through a Kolmogorov-Smirnov index D(n). If the distributions are the same, then this index is D(n)=0. On the contrary if the distributions have no overlap, then D(n)=1, and intermediate values of D(n) determine the degree of network similarity. We can then calculate this index for different values of n, and find how the scale of observation influences the similarity. Two networks may be similar at small scales but different at larger scales, which means that, for instance, diffusion at short scales would look similar but we would start see deviations as the scale increases.
Notice that this measure is independent of the network size, as long as n remains much smaller than the network size. Therefore, we can compare two networks without the requirement of having the same or even similar size.
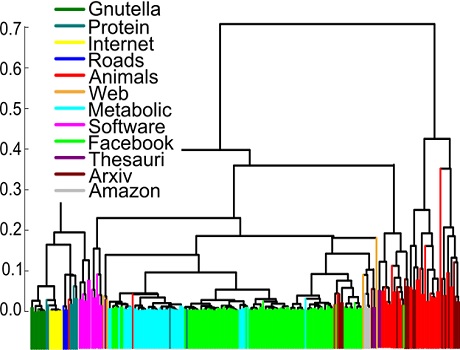
Networks of similar origin are detected to be closer to each other by the n-tangle method.
In our paper Revealing effective classifiers through network comparison we found that the n-tangle method works very well in all cases that we studied. The method nicely separated networks according to their origin, so that two networks representing metabolic networks were much closer to each other rather than with facebook friendship networks. More intriguingly, within the same family of networks we were able to discover consistent trends, providing external or internal factors that can be further evaluated on their importance. For example, we found that University friendship networks were much closer to each other if the two Universities were of similar size, compared to Universities of different size.